Product Engagement Metrics
Churn Control
The Why & So What of Product Analytics
Product Engagement Metrics
Churn Control
The Why & So What of Product Analytics
Analyzing Churn Data
Turning Metrics into Actionable Insights
If you’ve already gone through Identifying Churn: Spotting the Warning Signs, then you know the basics of recognizing when a customer might be on their way out. You might well be wondering: you’ve identified the signs of churn — now what? Good question. It’s now time to dig into the data and figure out why customers are leaving. Going through churn data isn’t just about looking at who’s leaving — it’s about understanding the patterns and trends that can help you stop churn in its tracks. Let’s break this down into simple steps.
Segmenting Customers: Who’s at Risk?
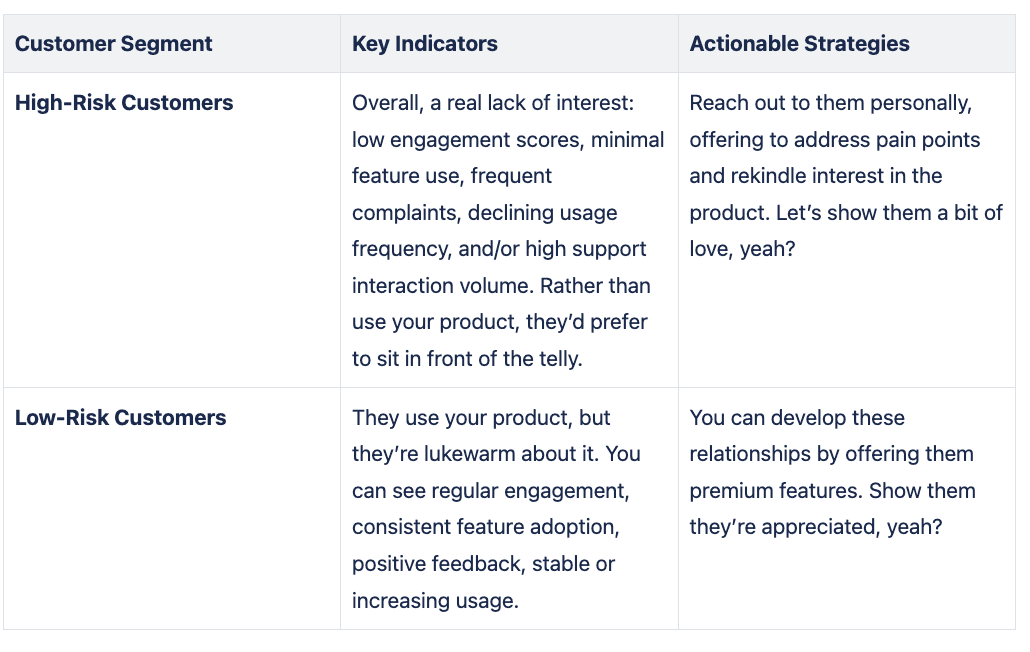
Not all customers are created equal, and neither is their risk of churning. This is where segmentation comes into play. By dividing your customer base into groups — like high-risk and low-risk — you can target your efforts where they’ll have the most impact.

Demographics and Psychographics: The Human Side of Churn
Understanding the demographics and psychographics of your customers can give you great insights into why they might churn. These two words might at first seem mystifying. In a nutshell, demographics cover the basics — age, gender, income, location — while psychographics dive into their attitudes, values, and lifestyles.
For example:
Younger Customers might be more likely to churn if they perceive your product as outdated.
Higher-Income Customers might churn if they feel the product doesn’t offer premium value or a high-end user experience.
By understanding these factors, you can tailor your product and messaging to better fit the needs of different customer groups.
Using Product Engagement Data for Churn Analysis
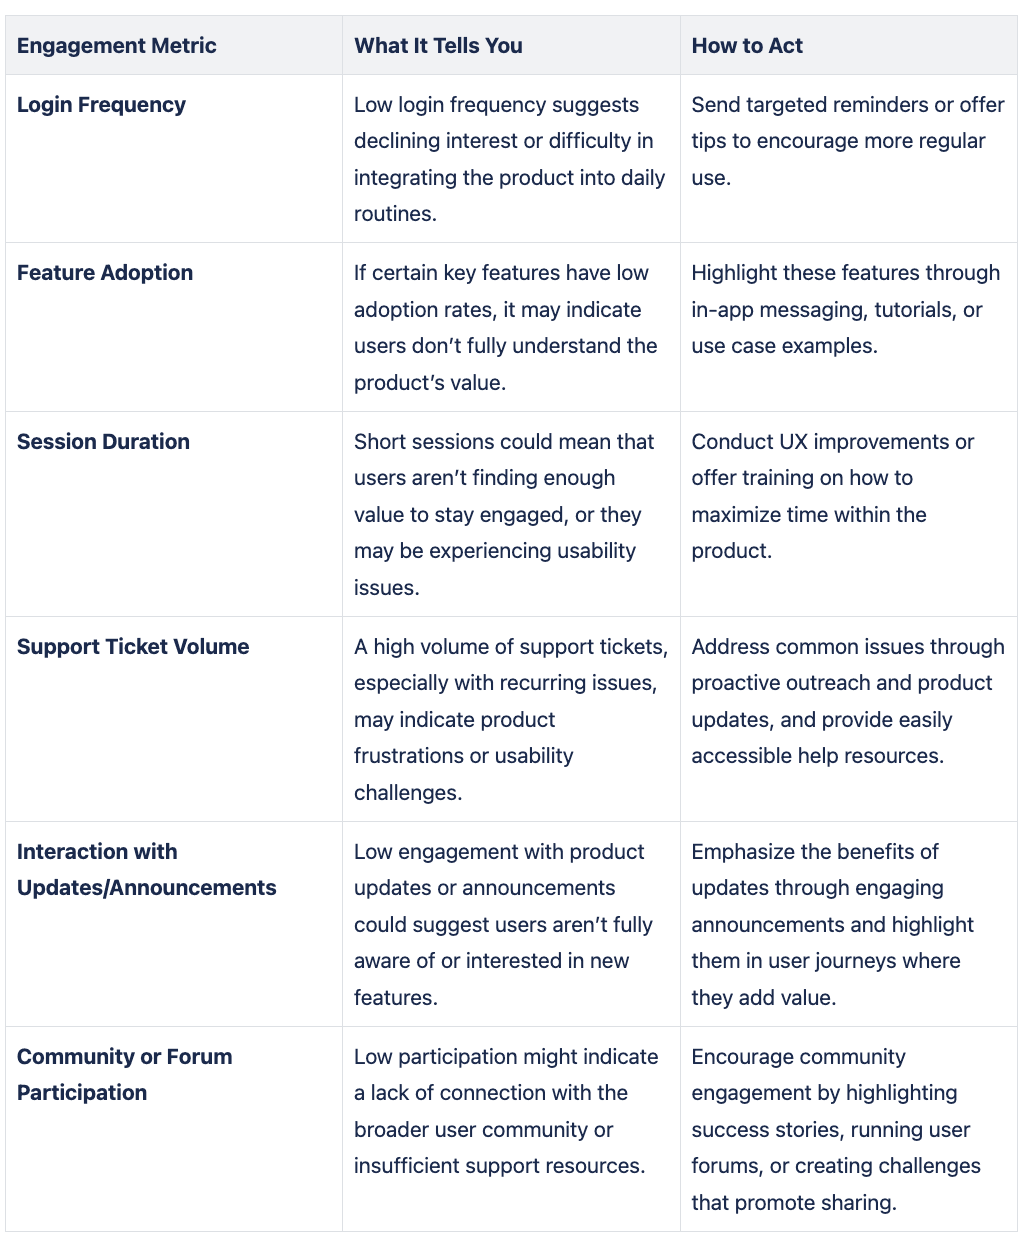
Product engagement data gives you crucial insights that go beyond basic segmentation and demographics. This data helps you understand how customers are interacting with your product and where potential issues might lie. If you want a bigger, stronger business, it’s essential.

Calculation and Benchmarking: How Do You Stack Up?
Knowing your churn rate is crucial, but it’s really just the start. You also need to benchmark it against industry standards or your own historical data to understand what it really means. For instance, if the industry average churn rate is 5% and you’re sitting at 7%, that’s a sign you need to dig a bit deeper and figure out exactly what’s going wrong.
The Bottom Line: Information is Your Best Defense Against Churn
Churn isn’t just a number — it’s a mystery story. And, in a sense, you’re a detective, trying to solve that mystery. By going through churn data, segmenting customers, and understanding the demographics, psychographics, and engagement metrics at play, you can uncover the root causes of churn. This knowledge enables you to turn the tide in your favor. There’s an old phrase, ‘knowledge is power’: it certainly applies here
Content
Analyzing Churn Data
Turning Metrics into Actionable Insights
If you’ve already gone through Identifying Churn: Spotting the Warning Signs, then you know the basics of recognizing when a customer might be on their way out. You might well be wondering: you’ve identified the signs of churn — now what? Good question. It’s now time to dig into the data and figure out why customers are leaving. Going through churn data isn’t just about looking at who’s leaving — it’s about understanding the patterns and trends that can help you stop churn in its tracks. Let’s break this down into simple steps.
Segmenting Customers: Who’s at Risk?
Not all customers are created equal, and neither is their risk of churning. This is where segmentation comes into play. By dividing your customer base into groups — like high-risk and low-risk — you can target your efforts where they’ll have the most impact.

Demographics and Psychographics: The Human Side of Churn
Understanding the demographics and psychographics of your customers can give you great insights into why they might churn. These two words might at first seem mystifying. In a nutshell, demographics cover the basics — age, gender, income, location — while psychographics dive into their attitudes, values, and lifestyles.
For example:
Younger Customers might be more likely to churn if they perceive your product as outdated.
Higher-Income Customers might churn if they feel the product doesn’t offer premium value or a high-end user experience.
By understanding these factors, you can tailor your product and messaging to better fit the needs of different customer groups.
Using Product Engagement Data for Churn Analysis
Product engagement data gives you crucial insights that go beyond basic segmentation and demographics. This data helps you understand how customers are interacting with your product and where potential issues might lie. If you want a bigger, stronger business, it’s essential.

Calculation and Benchmarking: How Do You Stack Up?
Knowing your churn rate is crucial, but it’s really just the start. You also need to benchmark it against industry standards or your own historical data to understand what it really means. For instance, if the industry average churn rate is 5% and you’re sitting at 7%, that’s a sign you need to dig a bit deeper and figure out exactly what’s going wrong.
The Bottom Line: Information is Your Best Defense Against Churn
Churn isn’t just a number — it’s a mystery story. And, in a sense, you’re a detective, trying to solve that mystery. By going through churn data, segmenting customers, and understanding the demographics, psychographics, and engagement metrics at play, you can uncover the root causes of churn. This knowledge enables you to turn the tide in your favor. There’s an old phrase, ‘knowledge is power’: it certainly applies here